Diagnostic Accuracy of Cardiac Magnetic Resonance Versus Fractional Flow Reserve: A Systematic Review and Meta-Analysis
Abstract
Background
Fractional flow reserve (FFR) is considered the gold standard for diagnosis of coronary artery disease (CAD). Stress Cardiac magnetic resonance (SCMR) has been recently gaining traction as a non-invasive alternative to FFR.
Methods
Studies comparing the diagnostic accuracy of SCMR versus FFR were identified and analyzed using Review Manager (RevMan) 5.3 and Stata software.
Results
A total of 28 studies, comprising 2,387 patients, were included. The pooled sensitivity and specificity for SCMR were 86% and 86% at the patient level, and 82% and 88% at the vessel level, respectively. When the patient-level data were stratified based on the FFR thresholds, higher sensitivity and specificity (both 90%) were noted with the higher cutoff (0.75) and lower cutoff (0.8), respectively. At the vessel level, sensitivity and specificity at the lower FFR threshold were significantly higher at 88% and 89%, compared to the corresponding values for higher cutoff at 0.75. Similarly, meta-regression analysis of SCMR at higher (3T) resolution showed a higher sensitivity of 87% at the patient level and higher specificity of 90% at the vessel level. The highest sensitivity and specificity of SCMR (92% and 94%, respectively) were noted in studies with CAD prevalence greater than 60%.
Conclusions
SCMR has high diagnostic accuracy for CAD comparable to FFR at a spatial resolution of 3T and an FFR cut-off of 0.80. An increase in CAD prevalence further improved the specificity of SCMR.
Introduction
The interpretation of invasive coronary angiography (ICA) based on anatomic reference standard has been the sole diagnostic modality for coronary artery disease (CAD) for a long time [1]. However, fractional flow reserve (FFR) and stress cardiac magnetic resonance (SCMR) are now coming into more frequent use. Recent studies have demonstrated the discordance between FFR and ICA, especially at the extremes of the angiographic spectrum (stenosis less than 30% or greater than 90%) [1]. Thus, an assumption of functional relevance based merely on the angiographic appearance of stenosis in the absence of FFR can be misleading. FFR appears to be more precise for the depiction of lesion-specific ischemia but at the cost of radiation exposure and an invasive procedure. SCMR perfusion scans have been suggested as an alternative to guide clinical decision-making, particularly in cases of CAD with stenosis of 50-75% [2]. Our study adds to the existing literature by pooling all available data to determine the diagnostic accuracy of SCMR for diagnosing CAD severity when compared to the gold-standard FFR.
Materials and Methods
Search strategy
A literature search for relevant articles was performed using PubMed, Ovid, Embase, clinicaltrials.gov, and Cochrane databases. There was no language or time restriction. The search strategies included various combinations of text-words and medical subject headings (MeSH) to generate two subsets of citations: one for magnetic resonance imaging using the terms such as “MRI”, “magnetic resonance imaging”, “magnetic resonance perfusion”, “cardiac MRI”, “SCMRI”, “MR perfusion imaging”; the other for fractional flow reserve using terms such as “FFR”, “fractional flow reserve”, “flow reserve”, “coronary flow reserve”, and “coronary pressure reserve”. The terms from the two subsets were combined in 1:1 combination using Boolean operators; and finally, results from all the possible combinations were downloaded into an EndNote library. Based on our research question, articles from the reference lists relevant to the clinical question were screened by an independent author.
Selection criteria and study collection
All observational (retrospective/prospective) studies and randomized control trials (RCT) on SCMR and FFR till September 30, 2019, were evaluated. Articles comparing the diagnostic accuracy of SCMR perfusion scan with FFR were included in the study. Papers with insufficient data, review articles, case reports, editorials, and conference papers were excluded.
Data extractions
Three authors independently screened titles and abstracts of all articles for relevance. A fourth author selected articles that met inclusion criteria. The full texts of articles that were potentially relevant to the study were screened by all the four authors to confirm eligibility. Baseline characteristics of the included population were reviewed, and data were collected for quality assessment to ensure study cohorts were statistically comparable. Risk factors for CAD, such as hypertension (HTN), hyperlipidemia (HLD), smoking, diabetes mellitus (DM), prior myocardial infarction (MI) and prior CAD were compared in each group of the included study to ensure comparability of the included population. Data were extracted into a combined Excel sheet. Disagreements were resolved by mutual consensus and after group discussion. The primary outcome was to determine the diagnostic accuracy of SCMR versus FFR for CAD severity.
Data and quality analysis
Raw data regarding the true and false positives and true and false negatives of each included study were obtained; and the combined measures of test accuracy (i.e., sensitivity, specificity, and diagnostic odds ratio (DOR)) for SCMR perfusion were calculated, keeping FFR as a standard. A bivariate model was obtained from data fitting. The parameters from the bivariate model were transformed into hierarchical summary receiver operating characteristic (HSROC) estimates. The area under the summary HSROC curve (AUC) was calculated to reveal the probability of accurately ranked diagnostic test values for a random pair of subjects (one with disease and one without disease). Chi-squared (χ2) tests were conducted to evaluate the heterogeneity of sensitivities and specificities among all studies. Subgroup analysis based on the resolution of SCMR and FFR cutoff points was performed to explore the potential heterogeneity factors using subgroup and meta-regression analysis. The statistical analysis was performed using the diagnostic accuracy statistical model on Stata and R mad package.
Quality of included studies
Quality of the included studies was assessed for potential bias and applicability concerns using the Quality Assessment of Diagnostic Accuracy Studies (QUADAS-2) standard questionnaire. The overall risk of bias and applicability concerns based on patient selection, index and reference standard, and the time duration between these tests were of low concern. Approximately 40% of studies either did not mention the duration or had more than 4 weeks difference between the aforementioned diagnostic tests. Only one study (Schuchlenz et al) had insufficient bias assessment data posing a 3% unknown bias risk to the index and reference standard tests [3] (Fig. 1). Twenty-five percent of the studies did not specify the baseline characteristics of its subjects and were stratified under the high-risk selection bias group (Fig. 2).

Overall risk of bias on the QUADAS-2 tool of the included studies in our study. QUADAS-2: the Quality Assessment of Diagnostic Accuracy Studies.

Risk of bias on the QUADAS-2 tool of the individual studies included in our meta-analysis. QUADAS-2: the Quality Assessment of Diagnostic Accuracy Studies.
Results
Search results and study characteristics
The initial search revealed 3,921 articles. After the removal of irrelevant and duplicate items, 238 articles were deemed relevant for full-text review. We further excluded 210 articles based on our selection criteria; and 28 studies were included for final analysis [3-30]. The preferred reporting items for systematic review and meta-analysis (PRISMA) flow diagram are shown in Figure 3.

PRISMA flow diagram showing the selection of studies from all databases. PRISMA: preferred reporting items for systematic review and meta-analysis.
A total of 2,387 patients and 3,936 coronary vessels were included [3-30]. Mean age was 63 years. Seventeen studies used 0.8, and 11 articles used 0.75 as FFR cutoff. Studies using both 1.5T (18) and 3.0T (10) SCMR spatial resolution were included. Semi-quantitative data analysis was employed in 10 studies, quantitative in nine studies, while the method of data analysis was not specified in the remainder. A time interval of 4 weeks or less was present between SCMR and FFR in 16 of the included studies, more than 4 weeks in three studies, and not specified in eight studies. Subjects included in all the available studies had a variable prevalence of the baseline characteristics and comorbidities, including prior MI, CAD, DM, HTN, multivessel disease, and smoking. The detailed characteristics of the included studies are summarized (Supplementary Material 1, www.cardiologyres.org).
Patient-level pooled diagnostic accuracy
At the patient level, pooled sensitivity and specificity for perfusion SCMR were 0.86 (95% confidence interval (CI), 0.79 – 0.91) and 0.86 (95% CI, 0.82 – 0.90), respectively (Fig. 4a, b). The DOR on a per-patient basis was 48.5 (95% CI, 23.52 – 100.41). The absolute AUC was 0.91, while partial AUC was 0.78 (Fig. 5). The test for equality of sensitivities showed moderate to severe heterogeneity I2 = 88% (χ2 = 137.17, df = 16, P value ≤ 2 × 10-16), while moderate heterogeneity was observed among the studies selected for equality of pooled specificities I2 = 66% (χ2 = 50.59, df = 16, P value = 1.85 × 10⁻⁵).

(a) Forest plot depicting individual and pooled sensitivity at the patient level. (b) Forest plot depicting individual and pooled specificity at the patient level.

Patient-level pooled diagnostic accuracy of CMR associated HROC vessel. CMR: cardiac magnetic resonance; HROC: hierarchical summary receiver operating characteristic.
Coronary-territory pooled diagnostic accuracy
At vessel level, SCMR showed an overall sensitivity of 0.82 (95% CI, 0.76 – 0.88), and specificity of 0.88 (95% CI, 0.84 – 0.94) compared to FFR (Fig. 6a, b). The absolute AUC, partial AUC and DOR were 0.91, 0.85 and 37.95 (95% CI, 22.60 – 63.73), respectively (Fig. 7). The test for equality of diagnostic accuracy showed moderate to severe heterogeneity among the studies selected for sensitivity (I2 = 89%, χ2 = 204.5, df = 21, P ≤ 2 × 10-16), and specificity (I2 = 85%, χ2 = 142.9, df = 21, P ≤ 2 × 10-16).

(a) Forest plot depicting individual and pooled sensitivity at the vessel level. (b) Forest plot depicting individual and pooled specificity at the vessel level.
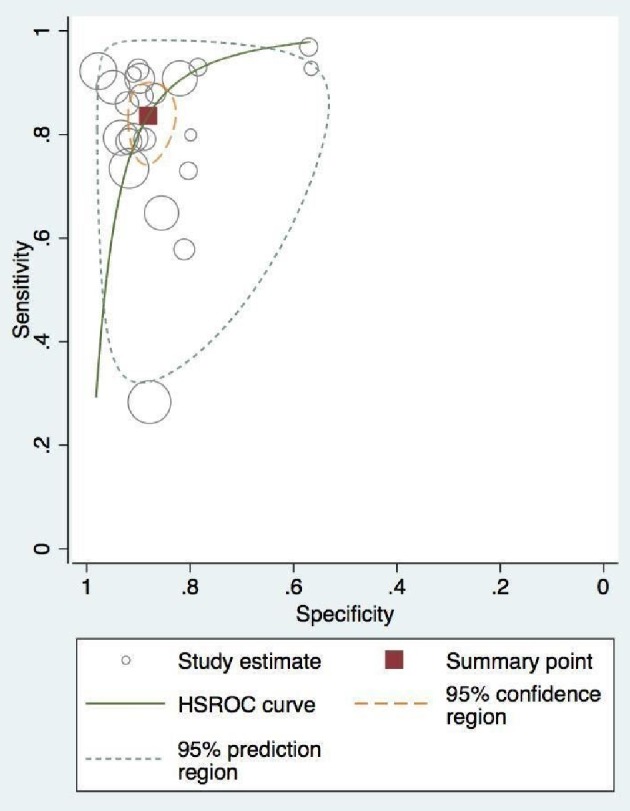
Vessel-level pooled diagnostic accuracy of CMR associated HROC. CMR: cardiac magnetic resonance; HROC: hierarchical summary receiver operating characteristic.
Subgroup analysis based on FFR threshold
Pooled diagnostic accuracy was stratified based on the two reported FFR thresholds. At the vessel level, sensitivity and specificity at the lower FFR threshold (0.8) were significantly higher at 0.88 (95% CI, 0.84 – 0.91) and 0.89 (95% CI, 0.82 – 0.93), compared to 0.80 (0.68 – 0.88) and 0.87(0.82 – 0.91) for FFR at the higher threshold (0.75) (Supplementary Material 2, www.cardiologyres.org). The DOR of FFR at the higher threshold was only 29.71, almost half of the DOR for the lower (0.80) cutoff (62.37 (95% CI, 32 – 118).
At the patient level, however, the higher cutoff exhibited a higher net sensitivity, 0.90 (95% CI, 0.84 – 0.94) but lower specificity 0.82 (95% CI, 0.73 – 0.88) compared to the lower cutoff, where the sensitivity was 0.85 (95% CI, 0.76 – 0.91) and specificity was 0.90 (95% CI, 0.84 – 0.93) (Supplementary Material 3, www.cardiologyres.org). The overall DOR favored the lower FFR threshold (52.3, 95% CI, 20.81 – 131.47) vs. (43.96, 95% CI, 18.98 – 101.84).
Subgroup analysis based on SCMR resolution
At vessel level, the specificity of SCMR at higher resolution (0.90, 95% CI 0.866 – 0.93) was significantly greater compared to lower resolution (0.85, 95% CI, 0.79 – 0.89) (Supplementary Material 4, www.cardiologyres.org), while the sensitivity was marginally higher for the lower resolution (0.85 vs. 0.81). The overall DOR was superior for higher resolution SCMR (44, 95% CI, 20 – 95) compared to (33, 95% CI, 16 – 66) for 1.5T SCMR. At the patient level, the sensitivity and specificity were comparable at both resolutions (Supplementary Material 5, www.cardiologyres.org).
Meta-regression analysis based on comorbidities
Meta-regression analysis based on covariates such as age (higher or lower than 65 years) and CAD prevalence were performed. SCMR had high sensitivity and specificity at 0.92 and 0.94, respectively, for studies with CAD prevalence greater than 60%, compared with the sensitivity of 0.83, and specificity of 0.84 with prevalence of CAD less than 60% (Supplementary Material 6, www.cardiologyres.org). Corresponding values at the vessel level were lower (Supplementary Material 6, www.cardiologyres.org). For both younger and older populations, the SCMR sensitivity was 0.86, but a higher specificity was noted for the younger population (0.89 vs. 0.81) (Table 1). A comparison of patient and vessel level data has been shown in Supplementary Material 7 (www.cardiologyres.org).
Table 1
| Variable | Sensitivity (95% CI) | Specificity (95% CI) | DOR |
|---|---|---|---|
| Vessel level, MI > 60% | 0.84 (0.77 – 0.88) | 0.86 (0.81 – 0.89) | 32 (19 – 53) |
| Patient, MI > 60% | 0.92 (0.88 – 0.94) | 0.94 (0.92 – 0.96) | 12 (10 – 33) |
| Vessel level, MI < 60% | 0.81 (0.66 – 0.91) | 0.88 (0.82 – 0.92) | 34 (14 – 80) |
| Patient, MI < 60% | 0.82 (0.74 – 0.89) | 0.84 (0.81 – 0.87) | 27 (15 – 50) |
| Vessel level, Age < 65 | 0.82 (0.74 – 0.88) | 0.89 (0.85 – 0.92) | 34 (14 – 80) |
| Patient, Age < 65 | 0.86 (0.79 – 0.91) | 0.89 (0.85 – 0.93) | 58 (26 – 126) |
| Vessel level, Age > 65 | 0.86 (0.71 – 0.94) | 0.81 (0.72 – 0.88) | 28 (12 – 67) |
CAD: coronary artery disease; MI: myocardial infarction; 95% CI: 95% confidence interval; DOR: diagnostic odds ratio.