Comparison of Post-Cataract Surgery Visual Outcomes and Quality of Life in Patients Bilaterally Implanted with Multifocal Intraocular Lenses
Abstract
Introduction
The present study compared visual outcomes in eyes with bilateral implantation of two multifocal intraocular lenses (MFIOLs)—the Eyecryl™ ACTV diffractive multifocal IOL (group 1) and AcrySof® IQ ReSTOR® multifocal IOL (group 2).
Methods
This was a prospective, two-group observational longitudinal study of 118 eyes from 59 patients conducted at Laxmi Eye Institute, Panvel, India. We evaluated the patients at 1, 3, and 6 months. We assessed visual acuity, contrast sensitivity, higher-order aberrations, reading speed, defocus curve, stereopsis, quality of life (QOL), and adverse events in these participants.
Results
The median (interquartile range) best-corrected distance visual acuity was 0.18 (0, 0.18) in group 1 and 0.18 (0, 0.18) in group 2 at 1, 3, and 6 months; the difference was not statistically significant (p = 0.48). The binocular defocus curve in both groups showed two peaks at 0.0 to −0.5 D and at −2.5 D. The mean (95% confidence interval) critical print size was significantly different between groups 1 and 2 at low illumination (0.918 [0.905, 0.931] vs 1.154 [1.128, 1.180]; p = 0.004). Contrast sensitivity was significantly better in group 1 under mesopic conditions but not under scotopic conditions. Though total QOL did not differ significantly between groups, the psychosocial quality of life was significantly better in group 1. About 23% of patients in group 2 reported unwanted images, compared with 0% in group 1 (p = 0.01).
Conclusion
We found that the Eyecryl and AcrySof groups were comparable for best-corrected visual acuity, photopic contrast sensitivity, defocus curve, reading parameters, stereopsis, and quality of vision. However, the Eyecryl group had better mesopic contrast and a lower proportion of unwanted images. Psychosocial quality of life was significantly better in the Eyecryl group; however, satisfaction was similar between groups. The cost of one of the lenses is less than the other. Thus, individuals with limited resources may opt for the Eyecryl™ ACTV, with similar visual outcomes.
Key Summary Points
| AcrySof® IQ ReSTOR® Multifocal IOL (Alcon Laboratories, Inc.) with low add power has a balanced design without prioritizing any foci. |
| Contrast sensitivity is decreased in multifocal IOLs (MFIOLs) due to distribution of light energy between different focal points. |
| Multifocal IOL patients experience dysphotopic phenomena of unwanted images, halos, streaks, or starbursts of light. |
| The Eyecryl ACTV diffractive multifocal IOL (Biotech Vision Care Pvt Ltd.) has comparable visual outcomes in terms of far, intermediate, and near visual acuity. |
| Defocus curves of Eyecryl ACTV diffractive and AcrySof® IQ ReSTOR® multifocal IOL confirm that MFIOLs with lower near adds have better intermediate visual acuity. |
| The Eyecryl ACTV diffractive multifocal IOL has comparable photopic and better mesopic contrast sensitivity than the AcrySof® IQ ReSTOR® multifocal IOL. |
| In general, reading speed parameters are not different between MFIOLs. |
| The Eyecryl ACTV diffractive multifocal IOL group had higher psychosocial satisfaction; overall satisfaction did not differ significantly between groups. |
| No unwanted photopic phenomena were noted in the Eyecryl ACTV diffractive multifocal IOL group. |
| Individuals with limited resources (particularly in low- and low-middle-income countries) may opt for Eyecryl™ ACTV for similar visual outcomes. |
Introduction
Improvements in cataract surgery techniques and the introduction of new-generation intraocular lenses (IOLs) have improved post-surgical unaided visual outcomes. In addition, patients expect spectacle-free vision after cataract surgery. Monofocal IOLs can provide adequate visual acuity only at a fixed distance—generally targeted to improve unaided distance vision. In this scenario, patients may require additional spectacles for activities requiring good intermediate or near vision [1].
In patients with bilateral cataracts, the surgeon may select one IOL for distance and another IOL for near vision—monovision. However, this choice does not allow bilateral stimulation of the visual cortex; thus, the patient loses the binocular advantage [2]. Because it is difficult to evaluate the acceptability of monovision pre-operatively due to the presence of cataract, it may not be possible to predict visual satisfaction post-surgery. Therefore, this may not be the procedure of choice in bilateral cataract surgeries.
To overcome these concerns, multifocal IOLs (MFIOLs) are an effective method to re-establish pseudo-accommodation after cataract surgery. Because of the multiple foci, these IOLs provide adequate vision for activities at multiple distances [3–5]. However, they are also associated with undesirable effects such as glare, halos, and reduced contrast sensitivity. The design of most commercially available MFIOLs may increase the spherical aberration of the eye; thus, the overall retinal image quality and quality of vision can be compromised [6]. Traditional MFIOLs may be a ‘mixed bag’ in cataract surgery. However, a new MFIOL, the AcrySof® IQ ReSTOR® multifocal IOL (Alcon Laboratories, Inc.), has a balanced design, without prioritizing any foci. This is achieved by apodization—gradual reduction of the height of the diffractive steps from the centre to the periphery and inclusion of a combination of diffractive-refractive design. Another MFIOL, the Eyecryl™ ACTV diffractive multifocal IOL (Biotech Vision Care Pvt Ltd.), is designed to prioritize distance and near vision over intermediate vision. In addition, the image clarity increases with negative aberrations; the negative spherical aberration induced by the lens compensates for the positive spherical aberration of the cornea.
In addition to good vision, it is important that optimal reading ability is achieved with MFIOL implantation. This can be assessed by reading acuity, reading speed, and contrast sensitivity—features that are important in one’s ability to read adequately. Finally, all these visual outcomes should be able to improve the quality of life in these patients. With this background, this study aimed to compare the vision, reading ability, and quality of life in patients bilaterally implanted with two different types of MFIOLs (group 1: Eyecryl™ ACTV and group 2: AcrySof® IQ ReSTOR®).
Methods
This is a prospective, two-group comparison longitudinal study of 118 eyes from 59 patients conducted at the Laxmi Eye Institute, Panvel, Maharashtra, India.
Study Participants
Consecutive consenting patients scheduled for cataract surgery were enrolled in the study and followed up for 6 months. The inclusion criteria were as follows: age greater than 18 years; regular corneal topography; pre-operative and post-operative corneal astigmatism of ≤ 0.75 D, and clear intraocular media; availability, willingness, and sufficient cognitive awareness to comply with examination procedures; and written informed consent for participation in the study. The exclusion criteria were as follows: pupil size > 5 mm scotopic size; best-corrected vision less than 6/9 and/or N/6; previous ocular surgery; ocular pathologies such as diabetic retinopathy, macular degeneration, glaucoma with field defects, or irregular corneal astigmatism; subjects who were professional pilots or truck/car drivers. Since we wanted to implant the IOLs bilaterally, the patients were enrolled only after both eyes fulfilled the inclusion criteria and had no exclusion criteria.
Patients who chose either of these MFIOLs were included in the study. The lenses were not assigned; rather the patients chose the lens based on their personal preference after the properties of lenses were explained to them by the counsellor. One MFIOL (group 2) is an apodized, diffractive single piece, foldable, hydrophobic acrylic, posterior-chamber IOL. This IOL has a 3.6 mm apodized central part and nine diffractive concentric zones on the anterior surface; these features provide one optical power for distance vision and a separate power for near vision. The add power of this MFIOL is +3.0 D at the lens plane, which provides about 2.5 D of add power at the spectacle plane. The recent advances in apodization technology ensure a gradual reduction in the height of diffractive steps from the centre to the periphery of the lens; this creates a smooth transition of light at various focal points, i.e. distance, intermediate, and near [4, 5, 7, 8].
The other MFIOL (group 1) is a single piece, natural yellow, with a central refractive zone and a diffractive zone surrounding it, followed by a peripheral refractive area. The IOL has a series of nine concentric rings with diffractive steps on the anterior surface of the lens, and the spacing between the steps reduces progressively from the centre to the periphery. The add power of this MFIOL is +3.0 D at the IOL plane, which provides about 2.4 D of add power at the spectacle plane [9]. The properties of both these MFIOLs are presented in Table Table11.
Table 1
The properties of the two IOLs included in the present study
| Name | Eyecryl™ ACTV | AcrySof® IQ ReSTOR® |
|---|---|---|
| Optics | Diffractive-refractive | Diffractive-refractive |
| Material | Hydrophobic acrylic containing natural chromophore | Hydrophobic acrylic containing natural chromophore |
| No. of diffractive rings | 9 | 9 |
| Apodization | Present | Present |
| Near add | +3.00 D | +3.00 D |
| Dioptric range | +7.5 D to +30 D (in +0.5 D steps) |
+6 D to +30 D (in 0.5 D steps) +30 D to +34 D (in +1 D steps) |
| Edge design | 360°; Square edge | 360°; square edge |
| A constant | 118.5 | 118.9 |
| Refractive index | 1.48 | 1.55 |
| Optic diameter | 6 mm | 6 mm |
| Overall diameter | 13 mm | 13 mm |
Study Procedures
The cataract surgery was performed by small-incision phacoemulsification with IOL implantation by the same surgeon. We created a clear corneal tunnel 2.8 mm in size with a curvilinear capsulorhexis. After phacoemulsification and automated irrigation/aspiration of the cortical remnants, we implanted the IOL in the capsular bag and sealed the incision wound by hydration without the help of a suture. The post-operative treatment consisted of topical moxifloxacin hydrochloride 0.5% eye drops four times a day for 10 days and prednisolone acetate 1% eye drops six times daily, with weekly tapering. All cataract surgeries were uneventful.
All patients were followed at 1, 3, and 6 months. The two primary outcome measures were (1) visual acuity [uncorrected—distance, intermediate and near, best-corrected distance visual acuity (BCDVA), and distance-corrected near visual acuity (DCNVA)] using the logMAR scale; (2) contrast sensitivity measured binocularly with distance correction under photopic (85 candelas [cd]/m2) and mesopic (3 cd/m2) conditions on a Pelli-Robson chart at a distance of 1 m. The secondary outcomes were as follows: (1) Higher-order aberrations (HOA) such as coma, spherical, trefoil, and secondary astigmatism were measured for internal, corneal, and total values at 2 and 4 mm pupil size to simulate photopic and mesopic conditions using the HOYA iTrace ray-tracing system (Tracey Technologies, Houston, TX, USA). (2) Reading speed was measured using the MNREAD chart in two illuminations, i.e. > 100 lx and < 100 lx. (3) Defocus curves for each MFIOL were obtained by plotting the mean of visual acuity with 13 values of defocus from +2.0 D to −4.0 D on the ETDRS chart in logMAR units. The defocus curve simulates the patient’s binocular visual acuity at different distances by placing positive and negative lenses in 0.5 D increments in front of the patient’s eyes. The measurements were performed by adding the lenses to the BCDVA. (4) Stereopsis in arc seconds was assessed by the Titmus Stereo Fly test, which measures how minutely the two eyes can discern differences in the distance of objects from the observer.
We also assessed visual quality of life (QOL) using the 33-item Indian Vision Functioning Questionnaire (IND-VFQ-33) at 3 months. The VFQ-33 has a total of 33 questions divided into three categories—general, psychosocial, and visual [10]. A score is given to each answer, and a higher score indicates poorer QOL. We also asked questions regarding patient experience of unwanted images, satisfaction with vision, and disappointment due to unwanted images [11, 12]. Finally, we recorded any side effects or complications over this 6-month period.
Statistical Methods
Data were entered in Stata version 15 software (StataCorp LLC, College Station, TX, USA). We estimated the means and standard deviations (SD), and median and interquartile range (IQR) for continuous variables. The normality of the data was assessed by the Shapiro–Wilk test. We estimated the proportions for categorical variables. The means were compared using the t test and the medians were compared using the Mann–Whitney test. The proportions were compared using the chi-square test or Fisher’s exact test for low expected cell counts. To account for changes in illumination, we adjusted the means for illumination values. We had a power of more than 80% to detect a difference of 0.06 units (in logMAR values) between these two groups (with an alpha value of 0.05). A p value of < 0.05 was considered statistically significant. The study was approved by the Institutional Ethics Committee at Laxmi Eye Institute and Laxmi Charitable Trust ECR/578/Inst/MH/2014/RR-17; LEI/001/2017. The study was conducted according to the principles of the Declaration of Helsinki of 1964, and all participants signed an informed consent form.
Results
Of these 59 patients, 29 (58 eyes) were in group 1 and 30 (60 eyes) were in group 2. The mean age (SD) was 59.5 (8.7) years in group 1 and 62.1 (6.1) years in group 2; the difference was not statistically significant (p = 0.21). There was no significant difference in the proportion of men and women in these groups (men: 48% [n = 14] vs 30% [n = 9]; women: 52% [n = 15] vs 70% [n = 21]) (p = 0.15). There were also no significant differences in the median BCDVA (0.18 [0.18, 0.48] vs 0.18 [0.18, 0.24]; p = 0.42), spherical error (0 [−2.5, 1.5] vs −0.75 [−2.0, 1.5]; p = 0.71), or cylindrical error (0 [−0.75, 0] vs 0 [−1.0, 0]; p = 0.98) at baseline between groups 1 and 2 (values in respective order). There were no significant differences in the demographic or visual parameters at baseline (Table (Table22).
Table 2
Baseline characteristics of participants in both IOL groups included in the present study
| Characteristics | Group 1 | Group 2 | p value |
|---|---|---|---|
| Age [mean (SD)]a | 59.6 (± 8.7) | 62.1 (± 6.1) | 0.07 |
| Gender [n (%)]a | |||
| Male | 14 (48%) | 15 (52%) | 0.15 |
| Female | 9 (30%) | 21 (70%) | |
| BCDVA logMAR [median (IQR)] | 0.18 (0.18, 0.48) | 0.18 (0.18, 0.24) | 0.42 |
| Spherical error D [median (IQR)] | 0.0 (−2.5, 1.5) | −0.75 (−2.0, 1.5) | 0.71 |
| Cylindrical error D [median (IQR)] | 0.0 (−0.75, 0.0) | 0.0 (−1.0, 0.0) | 0.98 |
aAge and gender were based on the total number of individuals
Vision and Higher-Order Aberrations
The median (IQR) uncorrected distance vision at 1 month was 0.18 (0.0, 0.18) in group 1 and 0.18 (0.18, 0.18) in group 2 (p = 0.38). The median (IQR) BCDVA was 0.18 (0, 0.18) in group 1 and 0.18 (0, 0.18) in group 2 at 1, 3, and 6 months; the difference was not statistically significant (p = 0.48). The median (IQR) DCNVA was 0.18 (0.18, 0.18) in group 1 and 0.18 (0.18, 0.18) in group 2 (p = 0.05) at all three visits. Finally, the median (IQR) distance-corrected intermediate visual acuity (DCIVA) was 0.40 (0.30, 0.40) in group 1 and 0.40 (0.30, 0.48) in group 2 at 1 month. Even though the difference was statistically significant (p = 0.01), it was not clinically significant (considered as two-line/10 letter-gain). In general, there were no significant differences in HOAs (internal, corneal, and total). We present detailed analyses of vision and HOAs in Table Table33.
Table 3
Best-corrected visual acuity (BCVA) and aberrations in two different types of multifocal IOLs in 118 eyes of 59 patients
| One month | Three months | Six months | |||||||
|---|---|---|---|---|---|---|---|---|---|
| Group 1 | Group 2 | p value | Group 1 | Group 2 | p value | Group 1 | Group 2 | p value | |
| BCVA | Median (IQR) | Median IQR | Median (IQR) | Median IQR | Median (IQR) | Median IQR | |||
|
BCDVA logMAR |
0.18 (0, 0.18) | 0.18 (0, 0.18) | 0.48 | 0.18 (0, 0.18) | 0.18 (0, 0.18) | 0.48 | 0.18 (0, 0.18) | 0.18 (0, 0.18) | 0.48 |
|
DCIVA logMAR |
0.40 (0.30, 0.40) | 0.40 (0.30, 0.48) | 0.002* | 0.40 (0.30, 0.40) | 0.40 (0.30, 0.48) | 0.002* | 0.30 (0.18, 0.30) | 0.30 (0.18, 0.48) | 0.002* |
|
DCNVA logMAR |
0.18 (0.18, 0.18) | 0.18 (0.18, 0.18) | 0.05* | 0.18 (0.18, 0.18) | 0.18 (0.18, 0.18) | 0.05* | 0.18 (0.18, 0.18) | 0.18 (0.18, 0.18) | 0.05* |
| Aberrations | |||||||||
| Internal | |||||||||
| HOA µ | 0.192 (0.116, 0.258) | 0.170 (0.116, 0.225) | 0.23 | 0.187 (0.117, 0.240) | 0.167 (0.119, 0.237) | 0.87 | 0.172 (0.117, 0.229) | 0.164 (0.115, 0.286) | 0.86 |
| Coma µ | 0.087 (0.042, 0.139) | 0.072 (0.048, 0.111) | 0.41 | 0.070 (0.039, 0.139) | 0.079 (0.057, 0.118) | 0.74 | 0.070 (0.039, 0.138) | 0.075 (0.053, 0.134) | 0.60 |
| Spherical µ | −0.055 (−0.08, −0.029) | −0.042 (−0.076, −0.006) | 0.28 | −0.055 (−0.080, −0.021) | −0.038 (−0.076, −0.006) | 0.31 | −0.041 (−0.079, −0.020) | −0.042 (−0.076, 0.007) | 0.62 |
| Trefoil µ | 0.064 (0.028, 0.120) | 0.060 (0.033, 0.097) | 0.86 | 0.067 (0.031, 0.122) | 0.071 (0.036, 0.120) | 0.80 | 0.063 (0.031, 0.120) | 0.066 (0.032, 0.122) | 0.69 |
| Secondary astigmatism µ | 0.029 (0.015, 0.048) | 0.025 (0.013, 0.049) | 0.46 | 0.030 (0.014, 0.058) | 0.031 (0.018, 0.059) | 0.65 | 0.029 (0.015, 0.057) | 0.035 (0.019, 0.059) | 0.36 |
| Corneal | |||||||||
| HOA µ | 0.148 (0.096, 0.209) | 0.150 (0.116, 0.175) | 0.82 | 0.118 (0.082, 0.162) | 0.134 (0.066, 0.184) | 0.62 | 0.118 (0.082, 0.160) | 0.139 (0.067, 0.181) | 0.28 |
| Coma µ | 0.057 (0.024, 0.105) | 0.051 (0.028, 0.078) | 0.40 | 0.047 (0.022, 0.092) | 0.042 (0.022, 0.082) | 0.69 | 0.047 (0.024, 0.092) | 0.041 (0.024, 0.079) | 0.51 |
| Spherical µ | 0.064 (0.035, 0.092) | 0.064 (0.019, 0.092) | 0.46 | 0.064 (0.039, 0.092) | 0.055 (0.020, 0.083) | 0.37 | 0.063 (0.039, 0.092) | 0.062 (0.027, 0.082) | 0.72 |
| Trefoil µ | 0.057 (0.028, 0.092) | 0.072 (0.028, 0.103) | 0.48 | 0.057 (0.028, 0.087) | 0.053 (0.033, 0.107) | 0.45 | 0.057 (0.028, 0.085) | 0.050 (0.033, 0.107) | 0.47 |
| Secondary astigmatism µ | 0.013 (0.008, 0.026) | 0.013 (0.007, 0.031) | 0.98 | 0.013 (0.005, 0.022) | 0.016 (0.008, 0.033) | 0.10 | 0.013 (0.005, 0.021) | 0.016 (0.007, 0.033) | 0.20 |
| Total | |||||||||
| HOA µ | 0.164 (0.115, 0.246) | 0.164 (0.112, 0.209) | 0.52 | 0.164 (0.115, 0.210) | 0.164 (0.110, 0.249) | 0.79 | 0.145 (0.115, 0.209) | 0.147 (0.095, 0.224) | 0.96 |
| Coma µ | 0.066 (0.044, 0.119) | 0.069 (0.043, 0.113) | 0.90 | 0.066 (0.043, 0.119) | 0.079 (0.039, 0.125) | 0.75 | 0.066 (0.043, 0.111) | 0.075 (0.037, 0.127) | 0.56 |
| Spherical µ | 0.016 (−0.007, 0.041) | 0.015 (−0.013, 0.032) | 0.84 | 0.012 (−0.012, 0.041) | 0.005 (−0.014, 0.033) | 0.58 | 0.012 (−0.008, 0.041) | 0.006 (−0.014, 0.032) | 0.51 |
| Trefoil µ | 0.068 (0.041, 0.095) | 0.078 (0.046, 0.122) | 0.73 | 0.091 (0.055, 0.107) | 0.077 (0.041, 0.126) | 0.26 | 0.084 (0.05, 0.104) | 0.079 (0.041, 0.139) | 0.99 |
| Secondary astigmatism µ | 0.026 (0.014, 0.047) | 0.021 (0.012, 0.047) | 0.23 | 0.030 (0.019, 0.047) | 0.031 (0.017, 0.055) | 0.80 | 0.029 (0.021, 0.047) | 0.031 (0.017, 0.054) | 0.71 |
*Significant difference
Defocus Curve
The binocular defocus curve in both MFIOL groups showed two peaks at 0.0 to −0.5 D (6–2 m) and at −2.5 D (maximum near visual acuity at 40 cm). The visual acuity for intermediate distance was better than that for distance and near vision. The mean (SD) visual acuity at 0.0 D was 0.031 (0.060) in group 1 and 0.080 (0.096) in group 2 (p = 0.02); at −1.0 D it was 0.13 (0.018) in group 1 and 0.20 (0.023) in group 2 (p = 0.02); and at −1.5 D it was 0.19 (0.015) in group 1 and 0.25 (0.019) in group 2 (p = 0.03). At these three distances, the difference in the means was statistically significant; group 1 was marginally better than group 2. Defocus curve analyses are show in Fig. 1. As seen in the figure, the defocus curve was slightly better in group 1 than group 2 for distance and intermediate range, with similar results for near range. Thus, group 1 performed better than group 2 for distance and near vision.
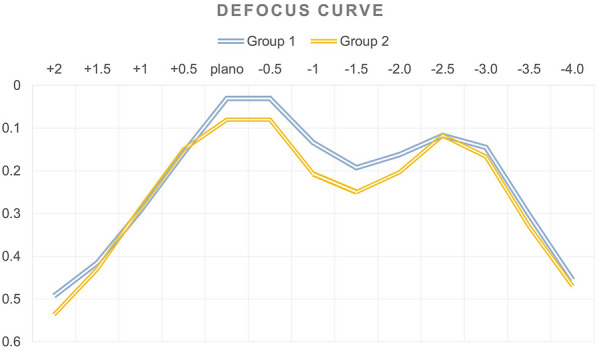
Defocus curves in the 59 patients in the Eyecryl and AcrySof groups
Other Parameters
The analyses were conducted in a subgroup of individuals. We analysed 11 participants in group 1 and 13 in group 2 for reading speed parameters. After adjusting for illumination, in general, there were no significant differences between these lenses (Table (Table4).4). However, the mean (95% confidence interval) critical print size was significantly different between groups 1 and 2 at low illumination (0.918 [0.905, 0.931] vs 1.154 [1.128, 1.180]; p = 0.004), but not at high illumination (1.009 [0.993, 1.026] vs 1.177 [1.162, 1.192]; p = 0.13).
Table 4
Contrast sensitivity, stereopsis, and reading speed parameters in 59 patients
| Group 1 Mean (± SD) |
Group 2 Mean (± SD) |
p value | |
|---|---|---|---|
| Contrast sensitivity (log CS) | |||
| Mesopic | 1.422 (0.142) | 1.335 (0.127) | 0.02* |
| Photopic | 1.493 (0.112) | 1.511 (0.105) | 0.51 |
| Stereopsis (arc secs) | 87.18 (35.45) | 98.60 (74.53) | 0.46 |
|
Reading speed parameters (words per minute—wpm), median (IQR) |
|||
| Reading speed in low illumination | 178.32 (177.13, 179.51) | 164.24 (161.90, 166.59) | 0.54 |
| Reading speed in high illumination | 149.26 (145.54, 152.97) | 173.03 (169.74, 176.32) | 0.29 |
| Reading acuity in low illumination | 0.237 (0.212, 0.263) | 0.311 (0.261, 3.610) | 0.08 |
| Reading acuity in high illumination | 0.207 (0.187, 0.228) | 0.251 (0.233, 0.269) | 0.72 |
| Critical print size in low illumination | 0.918 (0.905, 0.931) | 1.154 (1.128, 1.180) | 0.004* |
| Critical print size in high illumination | 1.009 (0.993, 1.026) | 1.177 (1.162, 1.192) | 0.13 |
*Significant difference
The mean (SD) contrast sensitivity was significantly better in group 1 than in group 2 under mesopic conditions (1.422 [0.142] vs 1.335 [0.127]; p = 0.02), but not under scotopic conditions (1.493 [0.112] vs 1.511 [0.105]; p = 0.51). Stereopsis did not differ significantly between groups. Additional analyses for the above-mentioned parameters are shown in Table Table44.
Quality of Life
A total of 48 patients (21 from group 1 and 27 from group 2) responded to the quality of life questionnaire (IND-VFQ-33). The mean (SD) total QOL was not significantly different between groups (12.62 [6.92] vs 16.56 [13.08]; p = 0.22). Similarly, the general and visual QOL did not differ significantly between these groups (Fig. 2). However, the psychosocial quality of life was significantly better in group 1 than in group 2 (0.86 [1.28] vs 2.11 [1.78]; p = 0.009).

Figure showing the mean quality of life in two different types of multifocal IOLs (Eyecryl and AcrySof). *p < 0.05
A total of 58 patients (28 in group 1 and 30 in group 2) responded to the questions on unwanted images and satisfaction with vision. About 23% (n = 7) of patients in group 2 reported unwanted images, compared with 0% (n = 0) in group 1 (p = 0.01), and 30% (n = 9) of the patients in group 2 attributed their disappointment with their current vision to unwanted images (0% [n = 0] vs 30% [n = 9]; p = 0.002). In general, however, there were no significant differences in the level of satisfaction between groups: extremely satisfied (43% [n = 12] vs 43% [n = 13]) and satisfied (57% [n = 16] vs 57% [n = 17]) (p = 0.97).
We did not record any complications such as inflammation or corneal edema in any patient at the 6-month visit.
Source: https://www.ncbi.nlm.nih.gov/pmc/