Scanning Electron Microscopy of Circulating Tumor Cells and Tumor-Derived Extracellular Vesicles
Please note that this image might contain sensitive content. Click to unblur.

Figure 1
Overview of cells by SEM on a glass slide (Panel A), a CellSearch cartridge (Panel B) and a 5 μm pore microsieve (Panel C). A higher magnification of the isolated cells is shown at the right of each technique (Panels D–F). The vertical lines in panels B and E is the αEpCAM ferrofluid covering the surfaces of all isolated objects and are perfectly aligned with the magnetic field line
Please note that this image might contain sensitive content. Click to unblur.

Figure 2
SEM images of leukocytes, PC3, and LNCaP cells on a glass slide (Panel A) and after being spiked in blood and isolated by the CellSearch (Panel B) and on 5 μm pore microsieves (Panel C). The arrows (Panel B) are pointing at spherical vesicles on the surface of a leukocyte isolated by the CellSearch.
Please note that this image might contain sensitive content. Click to unblur.
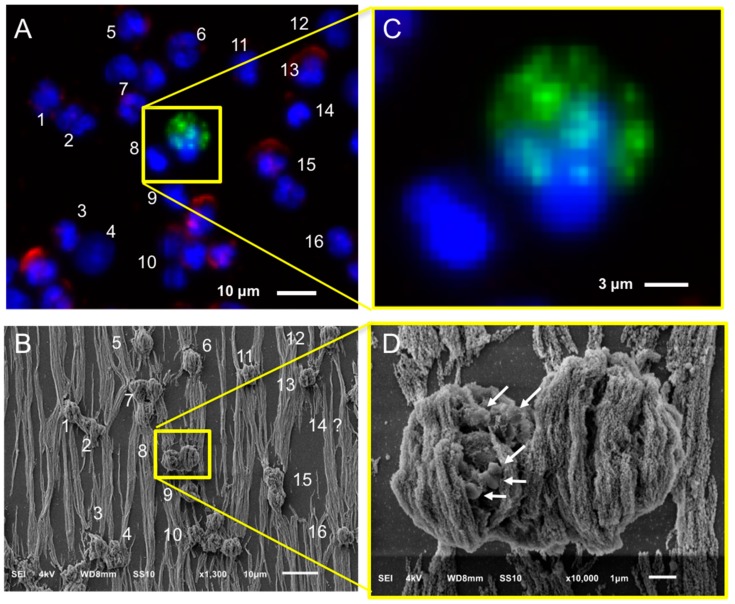
Figure 3
Relocation of an identified CTC of a CRPC patient by fluorescence (CellTracks Analyzer II) imaging (Panels A and C) after immunomagnetic enrichment using the CellSearch system and SEM imaging (Panels B and D). Magnified fluorescence and SEM images of the enclosed by the yellow square CD45−, CK− nucleated cell (left), and CD45−, CK+ apoptotic CTC (right) are shown at Panels B and D, respectively. Nucleus (DNA) is represented by blue, CK by green, and CD45 by red. The arrows of Panel D are pointing at vesicles on the surface of a cell of unknown lineage (DNA+, CK−, CD45−).
Please note that this image might contain sensitive content. Click to unblur.

Figure 4
Gallery of correlated fluorescence and SEM images of CTCs of a CRPC patient isolated by the CellSearch system. Nucleus (DNA) is represented by blue and CK by green. The arrows are pointing at spherical vesicles on the surface of CTCs (Panels D–G), single or aggregated vesicles on top of the ferrofluid covering the CTCs (Panels B,F), and bigger CK+ particles or membrane fragments of a not well defined shape (Panel H). Scale bars on fluorescence images indicate 3 μm.
Please note that this image might contain sensitive content. Click to unblur.

Figure 5
Relocation of an identified tdEV of a CRPC patient by fluorescence (CellTracks Analyzer II) imaging (Panels A,C) after immunomagnetic enrichment using the CellSearch system and SEM imaging (Panels B,D). Magnified fluorescence and SEM images of the enclosed by the yellow square DNA−, CK+, CD45− tdEV are shown at Panels B,D, respectively. Nucleus (DNA) is represented by blue, CK by green, and CD45 by red. The white arrows (Panel B) are pointing at vesicles of not defined origin (DNA−, CK−, CD45−). The red arrow (Panel B) is pointing at a leukocyte derived- extracellular vesicle (DNA−, CK−, CD45+).
Please note that this image might contain sensitive content. Click to unblur.

Figure 6
Gallery of correlated fluorescence and SEM images of tdEVs of a CRPC patient isolated by the CellSearch system. CK is represented by green. The pixels with lower CK intensity (Panels A–C,F) correspond to being shielded from ferrofluid tdEV parts. tdEVs of different CK intensities can be observed (Panel D: High CK intensity, Panels A–C: Medium CK intensity, Panels E,F: Low CK intensity). Scale bars of fluorescence images indicate 2 μm.
Please note that this image might contain sensitive content. Click to unblur.

Figure 7
Relocation of an identified CTC in a blood sample of a castration-resistant prostate cancer patient after microsieve filtration and fluorescence imaging (Panels A,C). Pores were relocated and the respective cells were SEM imaged (Panels B,D). Nucleus (DNA) is represented by blue and CK by green. Fluorescence and SEM images of the enclosed by the yellow square DNA+, CK+, CD45− CTC at Panels A,B are shown with higher magnification at Panels C,D, respectively. Arrows (Panel D) are pointing at the membrane or/and nucleus stripes of cells connecting the neighboring pores.
Please note that this image might contain sensitive content. Click to unblur.

Figure 8
Gallery of correlated fluorescence and SEM images of CTCs of a CRPC patient isolated by whole blood filtration using 5 μm microsieves. Nucleus (DNA) is represented by blue and CK by green. Membrane (Panel C) or nucleus (Panel B) stripes connecting the neighboring pores indicate cell damage and were found throughout the whole microsieve. CTCs ended up on (Panels A–C,F,H), within (Panel D), or in between the pores (Panels E,G,H).
Authors
Afroditi Nanou,1,* Mateus Crespo,2 Penny Flohr,2 Johann S. De Bono,2,3 and Leon W. M. M. Terstappen1,*
Auto closing in 2 seconds
This article is intended for educational purposes. All credit to the authors.